Show code
knitr::opts_chunk$set(echo = FALSE)
library(tidyverse)
library(palmerpenguins)
The basics of the
ggplot() function:
ggplot() allows for the easy plotting of various types
of graphic representations of data frames. These plots can start out as
simple but can also be highly complex and customized. Below is an
example of a simple point graph of data from the Palmer Penguins data
set.
Show code
ggplot(data = penguins, aes(x = flipper_length_mm, y = body_mass_g)) +
  geom_point()
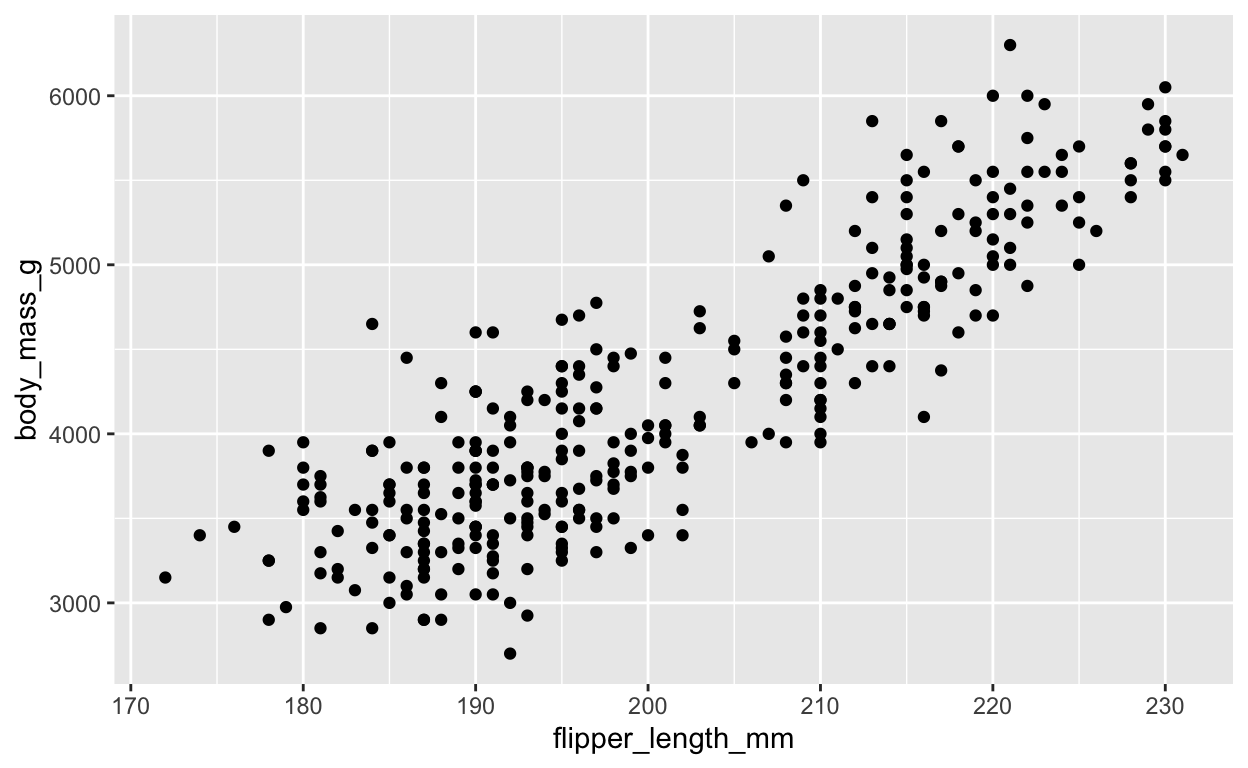
Note that it is critical to specify the type of plot desired after
the ggplot() function. Below is an example of using the
geom_line() function where above uses the
geom_point() function.
Show code
ggplot(data = penguins, aes( x = flipper_length_mm, y = body_mass_g)) +
  geom_line()
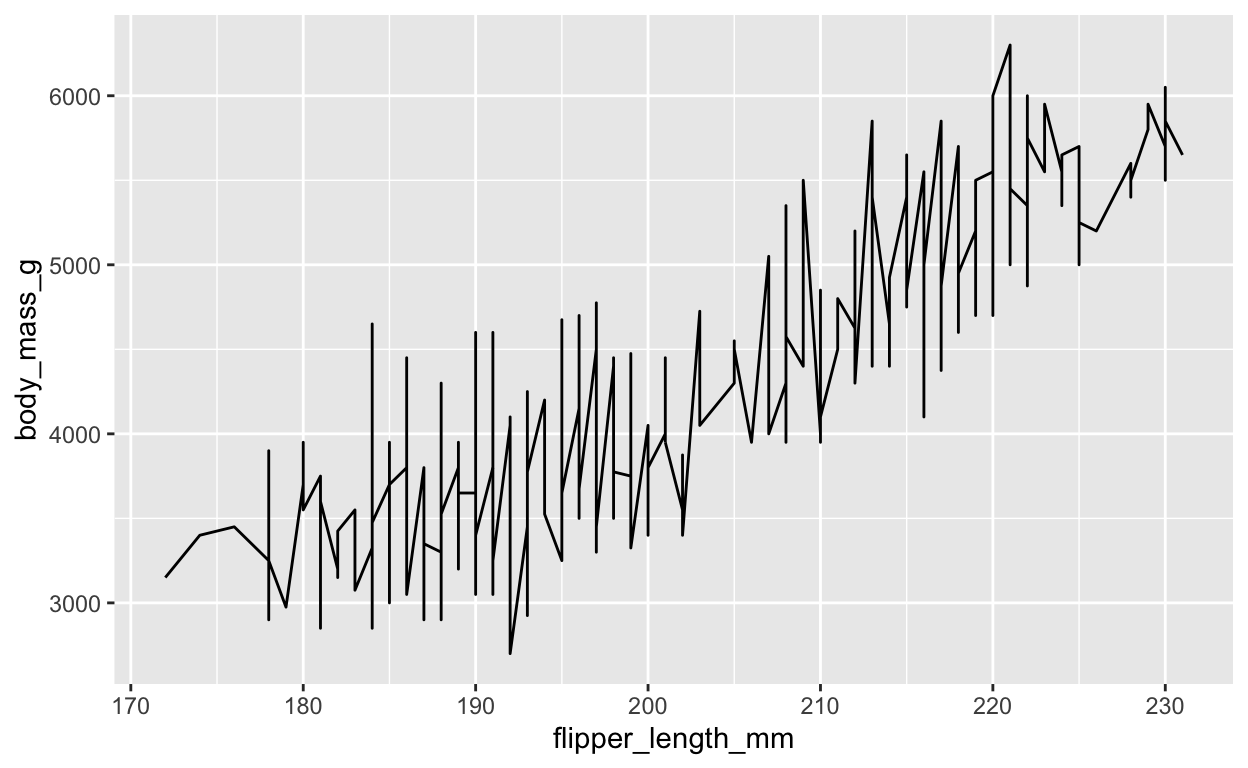
Looking at the scatter plot above (not the line plot) does not provide much useful information from the data set. In data science it is important to call out specific groups within your data. In the Palmer Penguins data, three separate species of penguins are observed. Let’s take a look at how we can separate the data by species within the plot.
Show code
ggplot(data = penguins, aes(x = flipper_length_mm, y = body_mass_g)) +
  geom_point(aes(color = species))

By seperating the data by species we can now clearly draw some distinct conclusions from the data for each species. For example, we know that Gentoo penguins will generally be the largest penguins.
It is always a good idea to take a look at your data BEFORE you begin
working with it. By looking at the penguins data prior to
plotting it, I would have known that there were three species within
this data set and that I should probably have seperated them in the plot
from the beginning.
This is a very brief introduction to the ggplot()
function. Future posts will add to the foundations set in this
introduciton.